 Citerank
Dashboard: your starting point
The Dashboard is the home screen: your score, your recent scans, your tracked prompts and crawls, insights from your data, and the next steps towards your first citation win.
Step by step
- Open the Dashboard #
It is the first item under Home.
- Follow the first steps #
New accounts see three steps to a first citation win.
- Check your score and scans #
See your latest results at a glance.
- Jump into a tool #
Open the tool behind any card.
Why it matters#
The dashboard is where you decide what to do today. It brings your score, your recent audits, your AI citation share and the sites cited instead of you onto one screen, so you can spot the change that matters without opening every tool. For a new account it lays out the three steps to a first citation win.
What it checks#
| Card | What it shows |
|---|---|
| Citerank Score | Your latest AI Visibility Score and its dimensions (AI discoverability, agentic protocol, brand presence and the rest) |
| Recent audits | Your average score and latest scans |
| AI Citation Share of Voice | How often you are cited across your tracked prompts |
| AI visibility by domain over time | The trend for each domain you work on |
| Cited instead of you | The domains AI engines cite where you are not |
| Competitors | Add competitors to benchmark your score against them |
| Tracked prompts and scheduled crawls | What is being monitored for you |
| Insights | AI-written observations drawn from your own scans |
Reading the results#
- A drop in the score or share of voice is the first thing to look at. Open What Changed to see which tool moved.
- Cited instead of you is your real AI-search competition. The same domain appearing again and again is the one to study.
- Empty cards mean the tool behind them has not run yet. "Citation data pending" fills once Citation Tracker or Prompt Tracking has run.
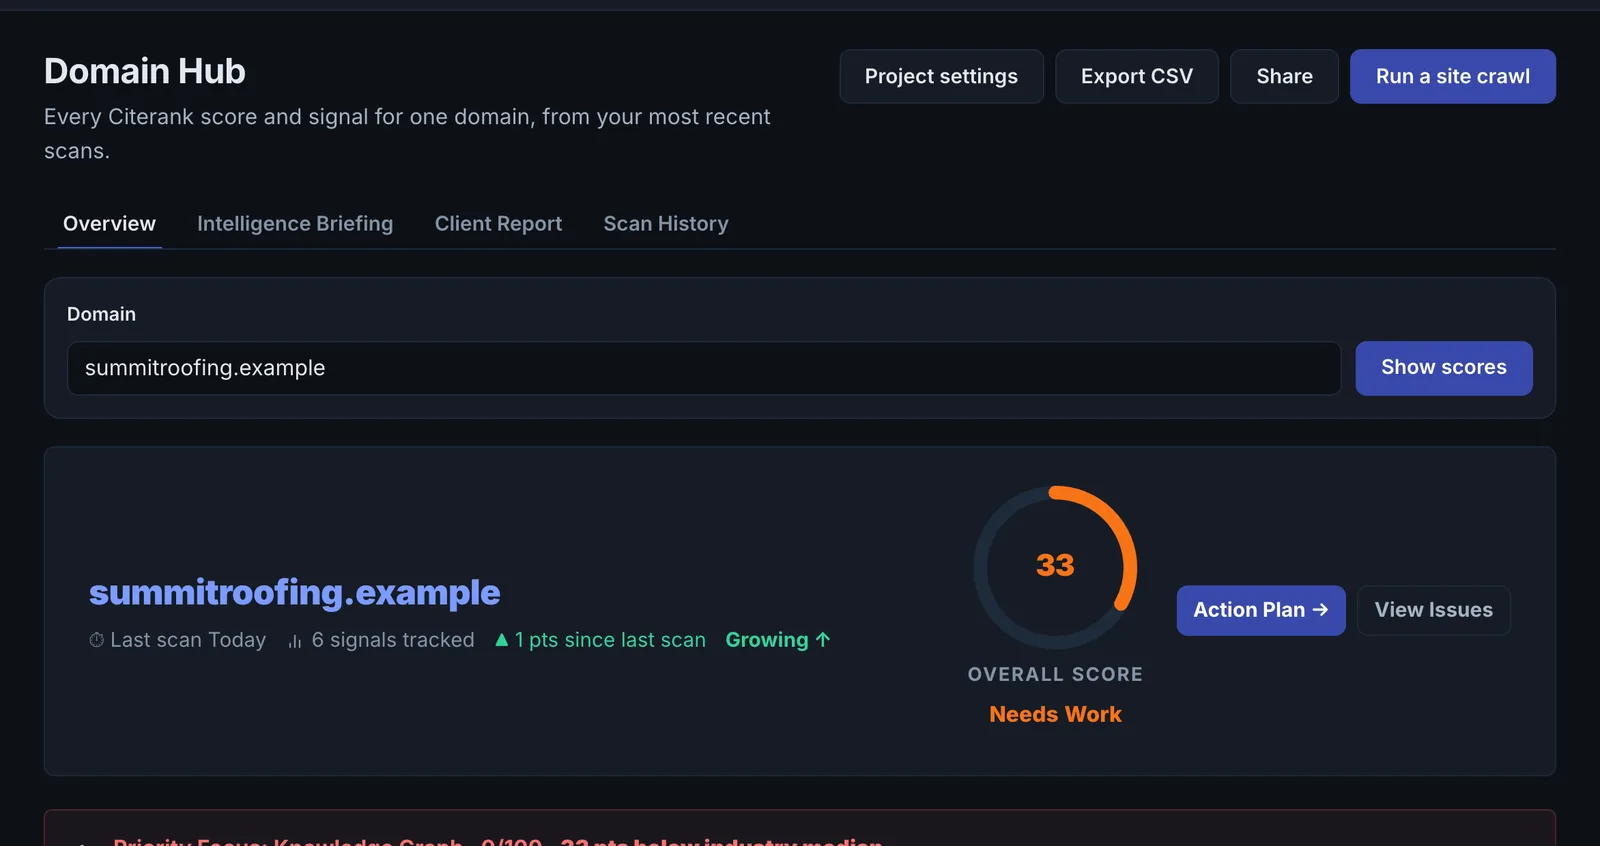
Implementing the fixes#
- New account: follow the three steps on screen (score, page audit, first tracked prompts). See Getting started.
- Score dropped: open What Changed, find the tool that moved, and follow its guide.
- A competitor keeps winning: run Citation Gap against them.
Worked example#
An in-house marketer opens the dashboard on Monday.
The Citerank Score is down 6 points and AI Citation Share of Voice is down from 21% to 14%. Cited instead of you shows one competitor in most of the lost spots. What Changed names Schema Coverage as the biggest mover: a plugin update stripped FAQPage schema from the service pages on Thursday. The marketer restores the schema, re-scans, and the score returns the same day; share of voice follows over the next monthly check.
Best practice#
- Add two or three competitors so every number has a reference point.
- Use the Client Report link on the dashboard for a quick, shareable summary.
Troubleshooting
The dashboard is empty #
Cards fill from the tools behind them. Run an AI Visibility Score first, then add prompts in Prompt Tracking.
A chart says it failed to load #
That card's data did not arrive in time. Reload the page. The rest of the dashboard is still current.
Citation data is pending #
The share-of-voice cards fill once Citation Tracker or Prompt Tracking has run for the site.
Not listed here? See Common problems for limits, checks, plans and pages that cannot be read.
Questions
Why is my dashboard empty? #
Why does a chart say it failed to load? #
Can I see more than one site? #
Something here does not match what you see in the app? Tell us and we will fix the guide.