 Citerank
Industry Benchmarks: your scores against industry estimates
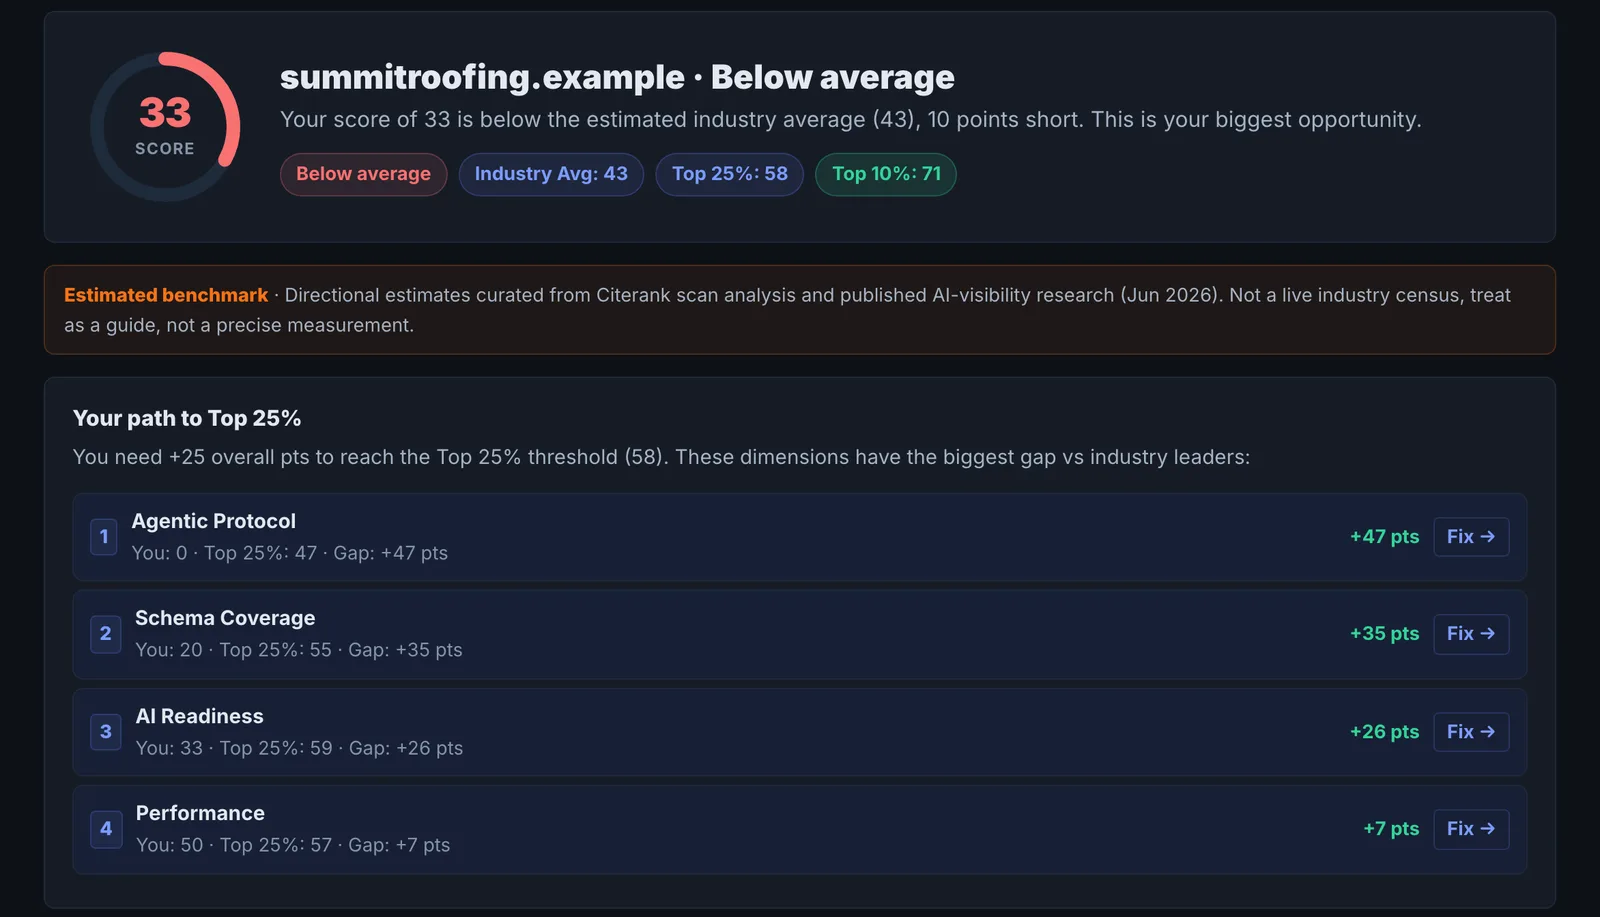
Industry Benchmarks runs a live AI visibility scan on your domain and sets your scores against directional figures for your industry (average, top 25% and top 10%), shows the schema types used by top pages, and lets you compare with a competitor side by side.
Step by step
- Open Industry Benchmarks #
Find it under Competitors in the left sidebar.
- Enter your domain and vertical #
Choose the industry closest to yours.
- Run it #
A live AI visibility scan runs and your scores are placed against the industry figures.
- Compare dimensions #
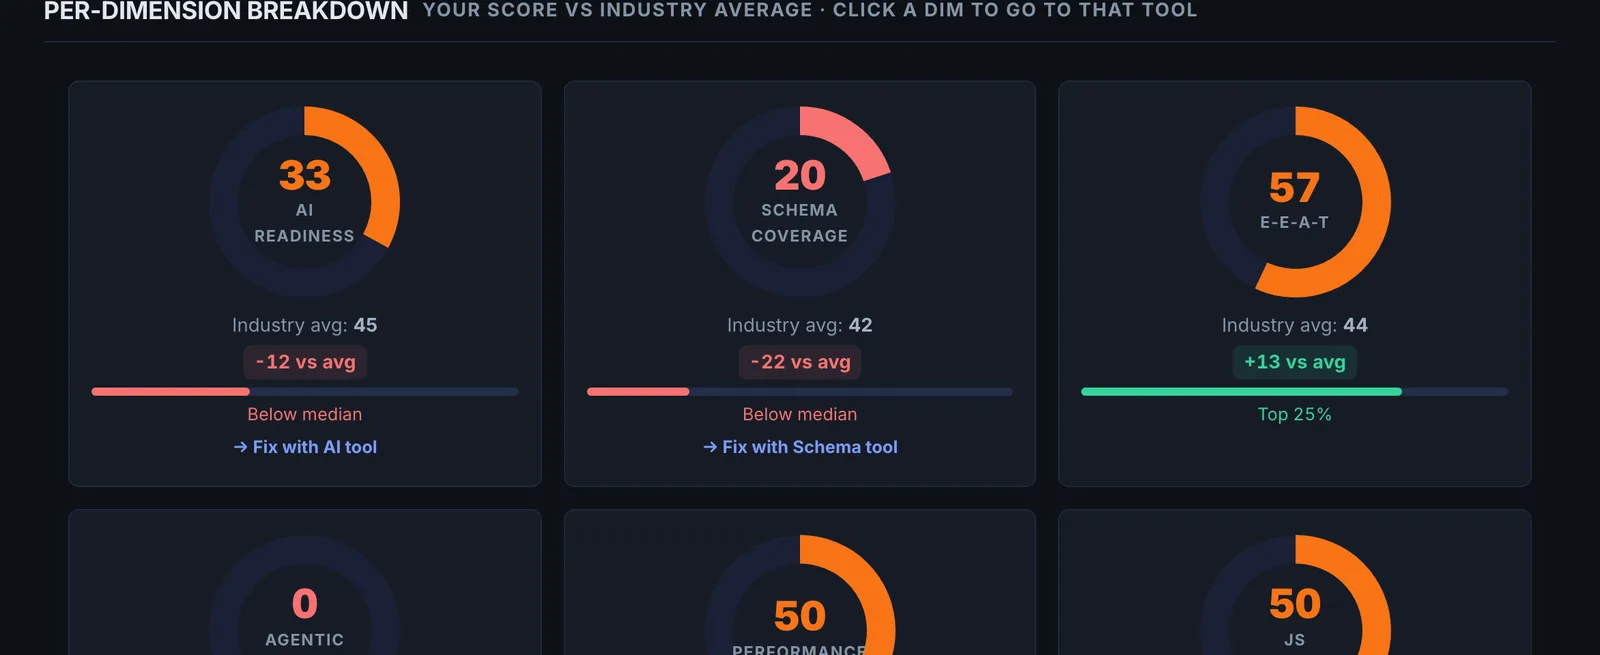
See your score against the industry average per dimension, and click one to go to the tool that improves it.
- Add a competitor #
Compare scores side by side with a real competitor.
Why it matters#
A score means more next to a reference point. Industry Benchmarks gives a rough reference for your vertical, and, more usefully, a measured side-by-side with a real competitor.
What it checks#
- Your live scan: the same on-site dimensions as the AI Visibility Score.
- Industry figures for your vertical: average, top 25% and top 10%. These are curated directional estimates, labelled as such.
- Schema types used by top performers for the page type.
- Competitor comparison: a second live scan of a competitor, side by side.
Reading the results#
- Below the industry average on a dimension: a likely priority, but confirm against a competitor.
- The competitor comparison is the measured part. Trust it over the industry figures.
- Schema used by top performers is a checklist for your own markup.
Implementing the fixes#
Click any dimension to go to the tool that improves it, and work the lowest-scoring dimension against your competitor first. See AI Visibility Score for fixes per dimension.
Worked example#
A regional accounting firm scans its site with the industry set to professional services.
Your scan: Content Citability 72, Schema & Entity Foundation 38. Industry figures: the estimated average for Schema is well above 38. Competitor comparison: a scan of a rival firm shows Schema at 70, with AccountingService, Person for each partner and FAQPage.
The measured part (the competitor scan) confirms the estimate: schema is the gap. The fix: AccountingService with @id on the home page, Person schema on each partner bio linked to the organisation, and FAQPage on the services pages. Re-run: Schema at 74.
Best practice#
Report the competitor comparison to clients, and describe the industry figures as estimates.
Troubleshooting
Benchmark data is not available #
The app saysInsufficient data. Benchmarks populate as more pages are scanned.
There are not enough comparable pages for that type yet. Use the competitor comparison, which is a live scan and does not depend on stored data.
The industry figures look off #
Industry figures are curated estimates, labelled as such, to point you in a direction. The competitor comparison is measured. When the two disagree, trust the competitor scan.
AI Discoverability could not be checked #
The site refused the requests for robots.txt, llms.txt and sitemap.xml, usually a firewall. Allow CiterankBot and scan again. See Common problems.
Not listed here? See Common problems for limits, checks, plans and pages that cannot be read.
Questions
Are the industry figures measured? #
Why is there no percentile? #
Should I pick the closest industry or the broadest? #
Something here does not match what you see in the app? Tell us and we will fix the guide.