 Citerank
Progress Dashboard: eight signals charted over time
The Progress Dashboard charts the scores your tools save, across eight signals, so repeated runs become a trend. Add up to three competitors for a side-by-side table and overlay chart.
Step by step
- Open Progress Dashboard #
Find it under Home in the left sidebar.
- Pick a domain and range #
Choose the site and period.
- Read the trend #
See each signal's change since your first scan in the range.
- Add competitors #
Up to three, for the side-by-side table and overlay.
- Act on momentum #
See what is rising, what is slipping and where to look.
Why it matters#
Clients and managers want to see movement. Every Citerank tool saves its score when it runs, and the Progress Dashboard turns those saves into trend lines, so regular work shows up as progress you can point to.
What it checks#
Eight signals, each charted from your saved scans: Citerank Score, citation rate, E-E-A-T, site health, topical authority, schema coverage, Knowledge Graph and brand. For each: the change since the last scan and against your first scan in the range. Add up to three competitors for a side-by-side table and an overlay chart.
Reading the results#
- Signal trends: each signal's line over the last 16 or 30 scans.
- Signal momentum: what is rising and what is slipping.
- Overlay chart: all domains together, to see who is gaining or losing momentum.
- Auto-generated insights: where to look next.
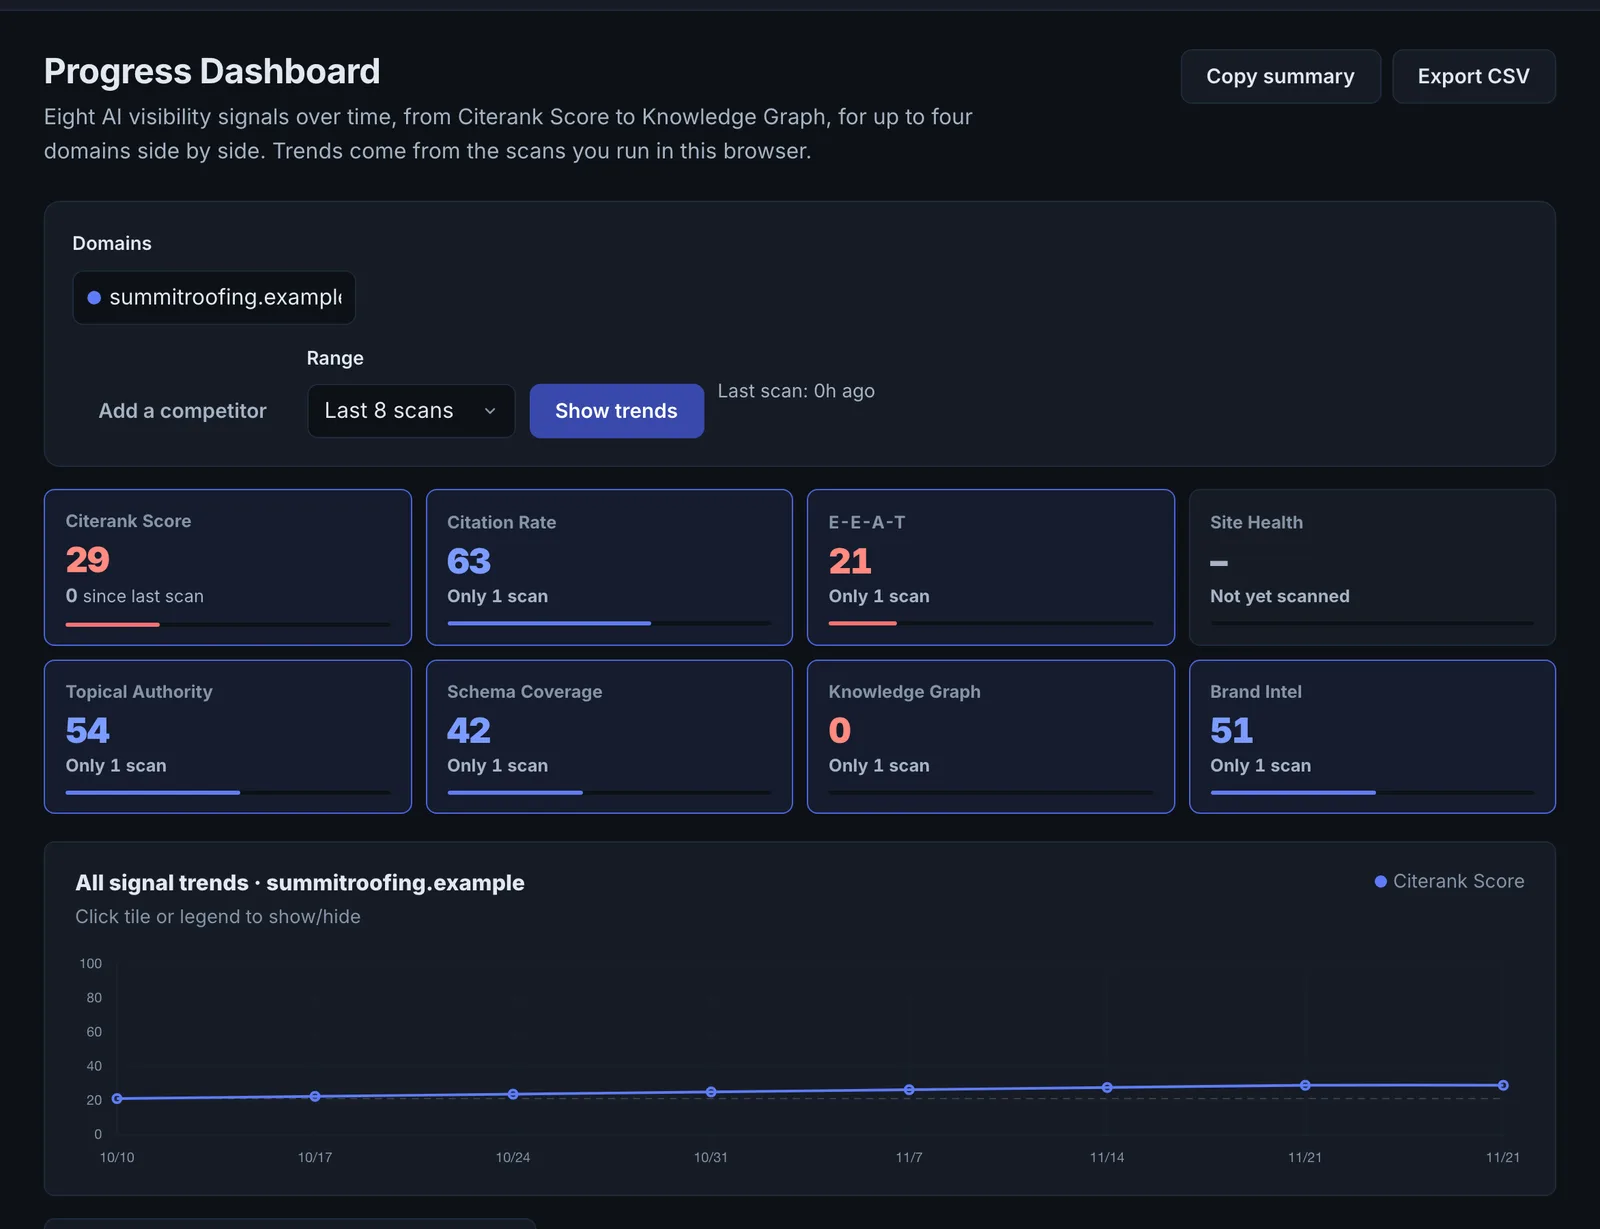
A signal with no line means the tool behind it has not run yet. Run more tools to build chart data.
Implementing the fixes#
For a slipping signal, open the tool that measures it and compare its latest findings with earlier runs. For a signal where a competitor gains faster, use the competitor tools to find out why.
Worked example#
An agency adds a client and two competitors.
Signal momentum shows the client's Citerank Score and schema coverage rising since the first scan in the range, and citation rate flat. The overlay chart shows one competitor gaining faster on citation rate. The agency's insight for the month: the on-site work is landing, but the competitor is out-publishing on the questions buyers ask, so next month's plan moves time from technical fixes to content.
Best practice#
Run the same tools on a regular cadence (monthly at least), starting with the Citerank Score, so the trend is meaningful.
Troubleshooting
Some signals are empty #
A signal is charted only after the tool behind it has run on the domain: for example E-E-A-T needs the E-E-A-T Deep Dive and Knowledge Graph needs a KG check. Run those tools to start the line.
There is no history #
Lines need at least two saved scans. Scan again after changes.
A competitor's line is missing #
Competitor lines come from scans of the competitor's domain. Run the same tools on the competitor.
Not listed here? See Common problems for limits, checks, plans and pages that cannot be read.
Questions
Why are some signals empty? #
Why is there no history? #
Does it use credits? #
Something here does not match what you see in the app? Tell us and we will fix the guide.