 Citerank
SOV History: your share of voice in AI answers over time
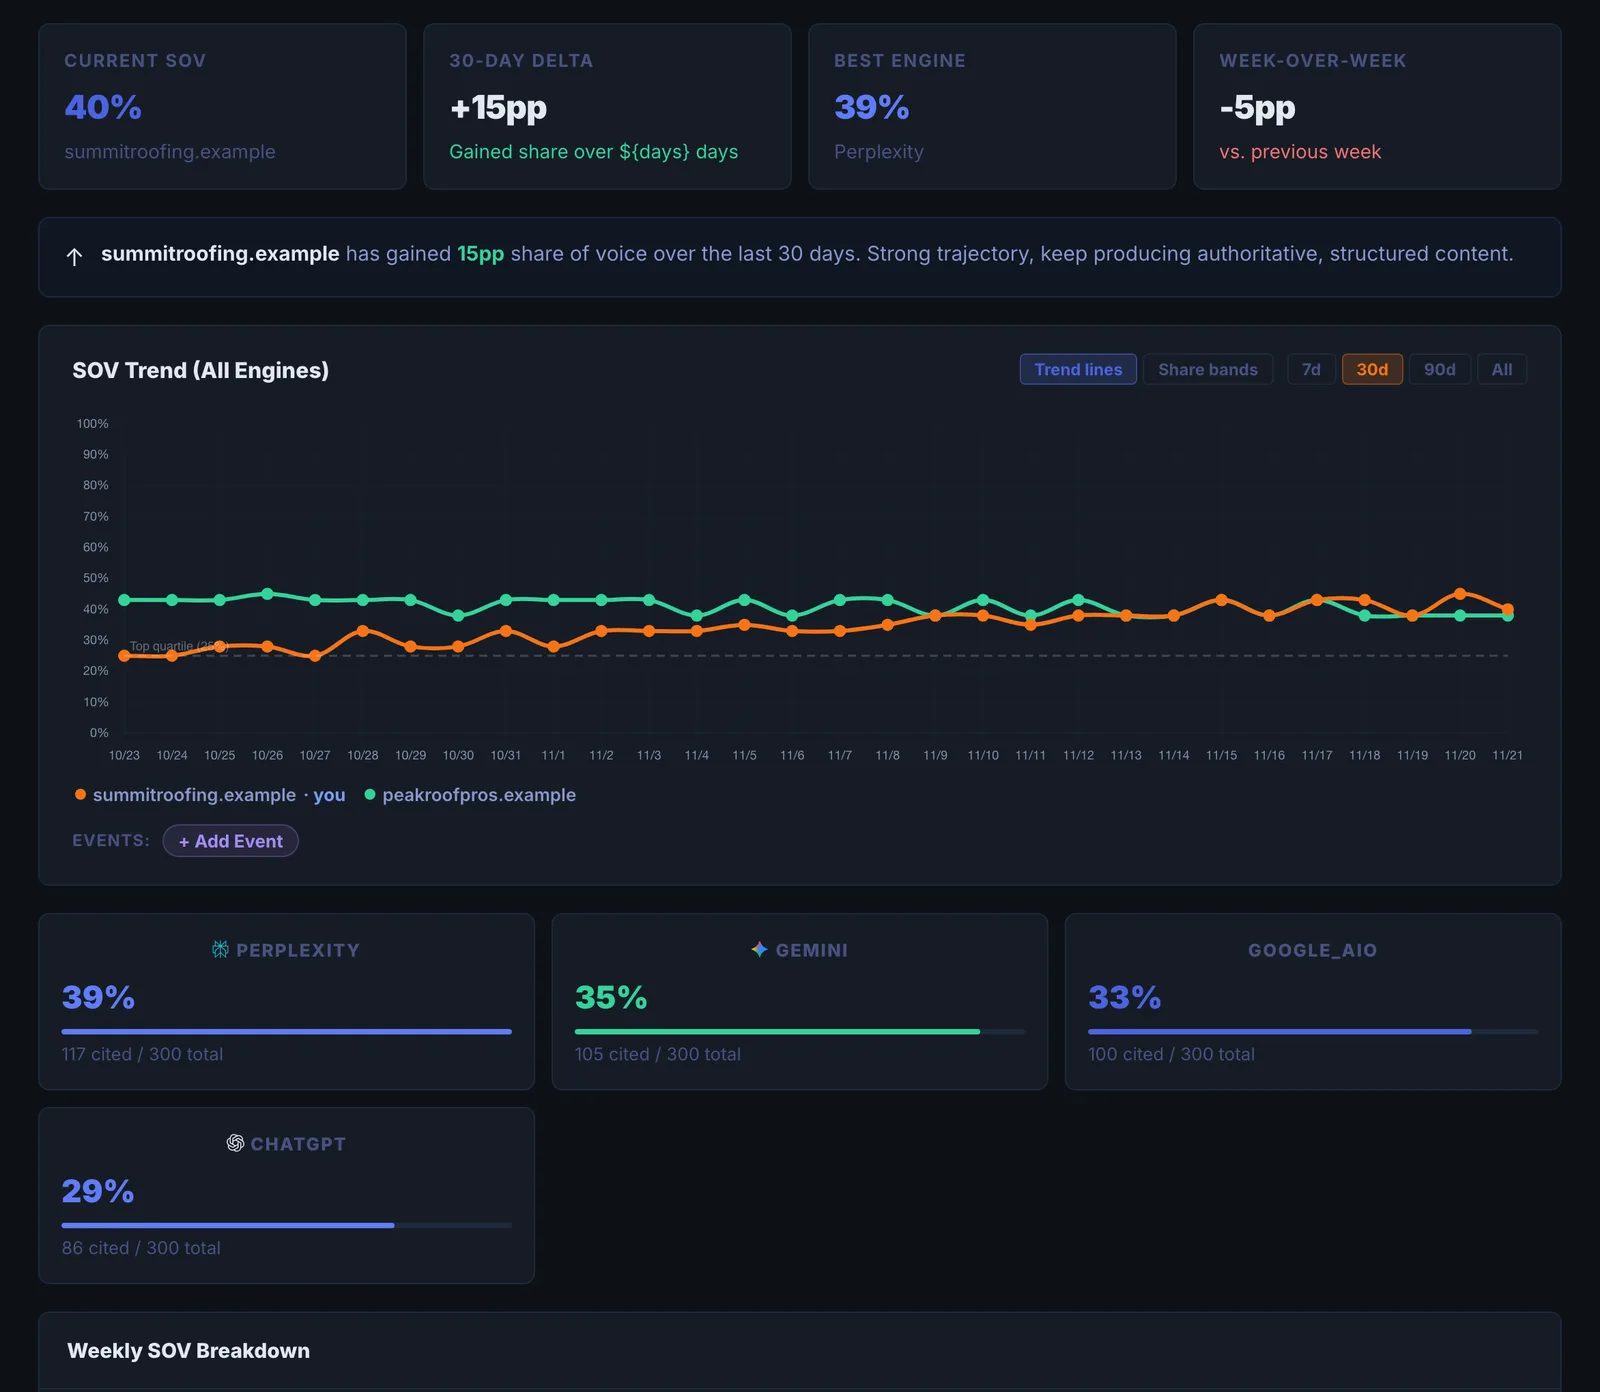
SOV History charts the share of your tracked prompts in which AI engines cite you, day by day, for the last 30, 60 or 90 days. Mark events such as a site release on the timeline to see what moved it.
Step by step
- Track prompts first #
SOV History charts the results of Prompt Tracking. With no tracked prompts there is nothing to chart.
- Open SOV History #
Find it under AI Visibility, Track, in the left sidebar, and choose the domain.
- Pick an engine and a range #
Choose All Engines or one engine, and the last 30, 60 or 90 days.
- Add events #
Click + Add Event to mark a site change, a campaign or a release on the timeline.
- Run the analysis #
Click Run Analysis for a short AI summary of the trend, the strongest engine and what to look at.
Why it matters#
A single check tells you where you stand. A trend tells you whether your work is paying off. SOV History is the long view of your AI visibility: is the share of answers citing you going up after the changes you made, and on which engine? With events on the timeline, it is also the chart that explains cause and effect to a client.
What it checks#
It does not run new checks. It reads the daily snapshots that Prompt Tracking writes: for each day and engine, how many of your tracked prompts cited your domain out of how many were checked. Share of voice is cited divided by checked.
Reading the results#
- The line is your share of tracked prompts that cite you. A rise after a release is the result you are looking for.
- All Engines vs one engine. All Engines sums every engine. Switch to one engine to see whether a change helped everywhere or only on, say, Gemini.
- Events line up changes with movement. AI answers usually lag site changes by one to four weeks.
- The AI analysis summarises direction, the strongest engine and anything unusual.
Implementing the fixes#
| What you see | What to do |
|---|---|
| Falling share on one engine | Check that engine's answers in Prompt Tracking for the prompts you lost and who replaced you. |
| Falling on every engine | Look for a site-wide cause: robots.txt, a redesign that moved content into JavaScript, removed pages. Run the Page Auditor on affected pages. |
| Flat after a release | Give it a month, then check that the changed pages were recrawled and that the prompts tracked are the ones those pages answer. |
| Rising | Note what you did as an event and repeat it on the next topic. |
Worked example#
A software company tracks 20 prompts. The line sits at 15% for two months.
On 3 March the team adds an event, "Comparison pages launched (5)". The line stays flat for two weeks, then rises to 22% by early April and 26% by May. Switching to single engines shows the rise is mostly ChatGPT and Gemini; Perplexity is flat. The AI analysis flags Perplexity as the engine to look at next.
What the team does with it: reports the rise to leadership with the event on the chart, and looks at the sources Perplexity cites for the tracked prompts, which turn out to be review sites the company is not listed on.
Best practice#
- Add an event for every meaningful change. It costs nothing and is the only way to explain the chart later.
- Keep the tracked prompt list stable. Adding or removing many prompts changes the denominator and moves the line by itself.
Troubleshooting
The chart is empty #
SOV History reads the snapshots Prompt Tracking writes. Add prompts there first. History starts with the first check.
The line is flat for weeks #
Prompts are checked monthly, so the line moves once a month per prompt. Use Check now in Prompt Tracking for a fresh point after a change.
An event did not save #
The app saysCould not save annotations
The event was not stored. Add it again in a moment.
Not listed here? See Common problems for limits, checks, plans and pages that cannot be read.
Questions
Where does the data come from? #
Why is the line flat for weeks? #
Are events saved? #
Something here does not match what you see in the app? Tell us and we will fix the guide.